- AJ Products UK
- Blog: Tips to Inspire Happiness at work
- Ergonomics in the workplace
- Survey - Desk Breaks & Workplace Wellbeing Statistics - UK 2024

Desk Breaks & Workplace Wellbeing Statistics - UK 2024
Workplace health professionals recommend that workers take hourly breaks; whether this be a short walk or simply standing up to stretch. The ASICS Global State of Mind study, conducted in 2024, found that two hours of uninterrupted desk time led to a noticeable decline in one’s mental health, with four hours of uninterrupted desk time leading to an 18% rise in stress levels.
With this in mind, we set out to discover the frequency of desk breaks the average UK worker takes, looking at whether this is in line with what healthcare professionals recommend.
To find out, in August 2024, we surveyed a demographically representative sample of 2,015 UK adults, using the market research company, Censuswide, asking ‘how long do you sit at your desk without taking a break?’
KEY FINDINGS
Desk Break Frequency
- 41.5% of UK adults with desk jobs take at least one break per hour.
- 25-34 year olds are the least likely age group to take hourly breaks, with only 31.6% doing so.
- Hybrid workers are the least likely to take hourly breaks (38.8%) compared to 41.4% of office-based workers and 44.9% of fully remote workers.
- Cardiff has the highest rate of hourly breaks, with 68.4% of workers taking at least one break per hour.
- Travel agents are the most likely profession to take breaks, with 66.7% taking at least one break per hour.
Neck, Shoulder, or Back Pain Frequency
- 21.3% of UK adults feel neck, back, or shoulder pain every day.
- 45-54 year olds are the most affected age group, with 26.3% experiencing pain daily.
- Remote workers experience daily pain most frequently (21.3%), compared to 18.2% of in-office workers and 13.02% of hybrid workers.
- Glasgow has the highest rate of daily pain, with 31.7% of residents affected.
- Conversely, London has the lowest rate of daily pain, with only 14.9% affected.
How often do people with desk jobs take breaks?
Whilst respondents to our survey, in the interest of being representative of the wider UK workforce, included professionals across a wide array of professions, for the purposes of this study, we specifically homed in on those with desk jobs and thus the data below is only representative of those who fit the ‘work from a desk’ criteria.
We asked this group about the frequency of breaks they take over the course of the working day.
Below are their responses:
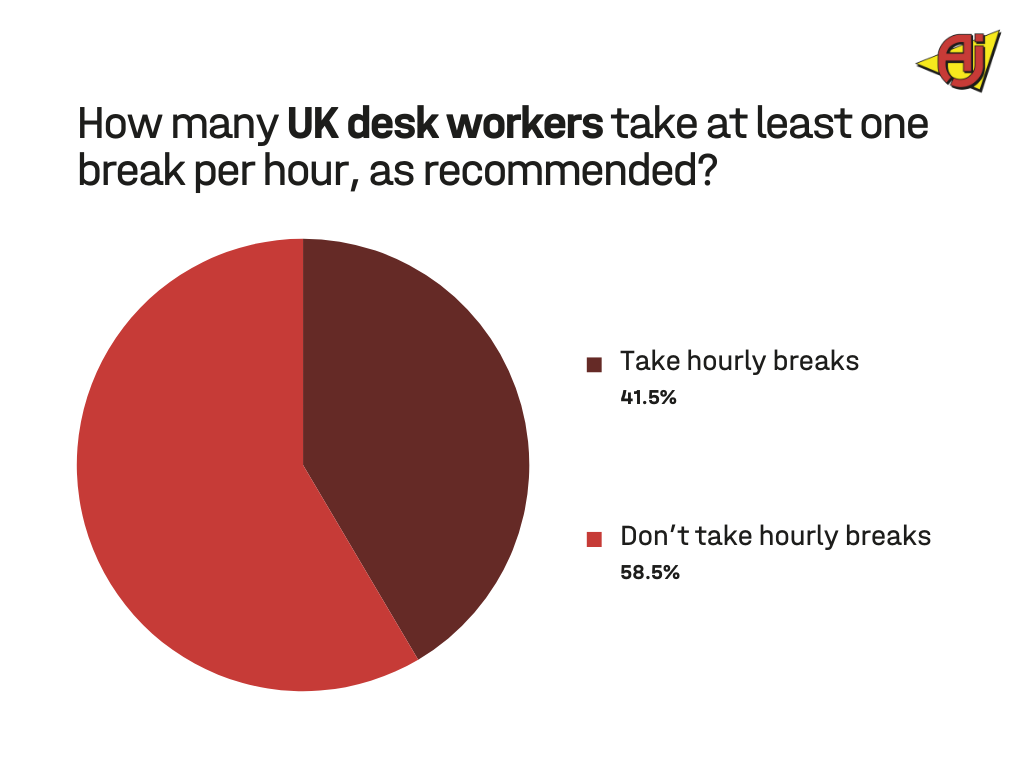
- Less than half (41.5%) of people with desk jobs in the UK take the recommended number of breaks (at least once an hour).
- 13% of desk workers take a minimum of 2 breaks per hour, while 28% take one hourly.
- Nearly a third of desk workers go 3 hours or more without taking a break (30%).
- 16% go at least 4 hours without taking some time away from their desk.
- 1 in 15 go 5 hours or more without a break (6.42%).
- And 1 in 36 don't take a break at all during their working day (2.73%).
Which age group is the most likely to take hourly breaks from their desk?
It’s also worth noting the role that age plays in the likelihood of one taking regular breaks.
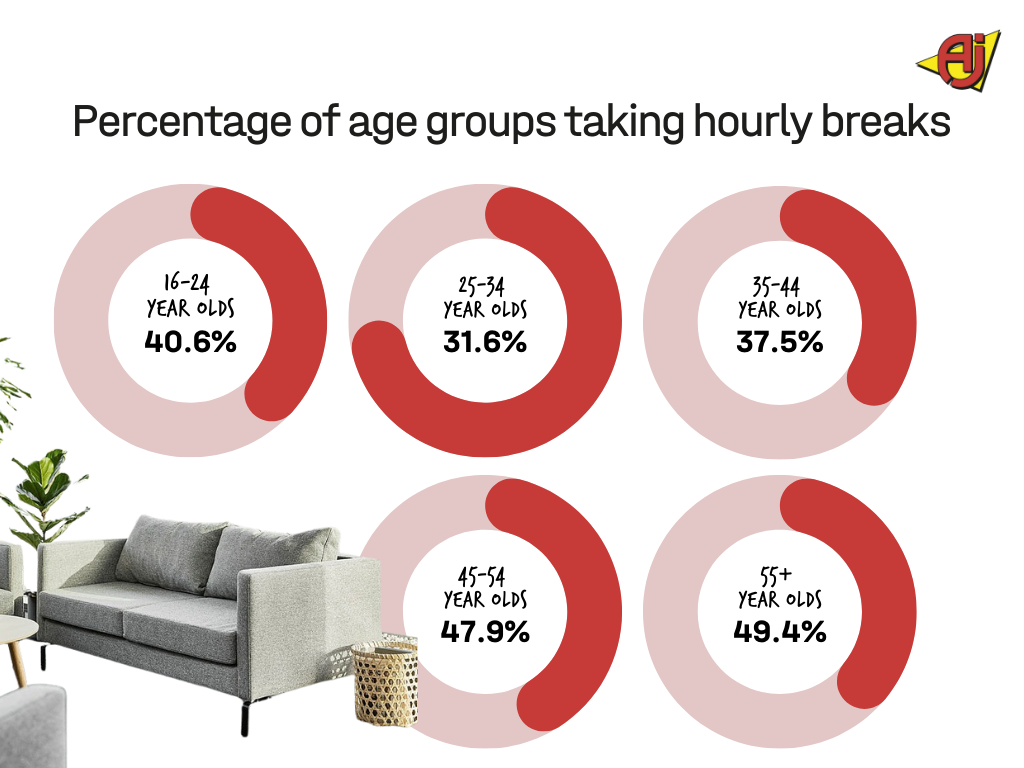
- Those aged 55 and over are the age group most likely, amongst UK workers with desk jobs, to take at least one break per hour.
- 49.4% of the 55+ year old desk job workers say they take at least one break per hour.
- After 55+ year olds, the age group most likely to take hourly breaks are 45-54 year olds (47.9%) followed by 16-24 year olds (40.6%).
- 25-34 year olds are the age group least likely to take hourly breaks (31.6%).
Does where one works from (i.e., home, at the office etc.) affect the likelihood of taking hourly breaks from their desk?
With a lot of discussion centred around the advent of flexible working, it’s interesting to explore which working arrangement most encourages regular breaks.
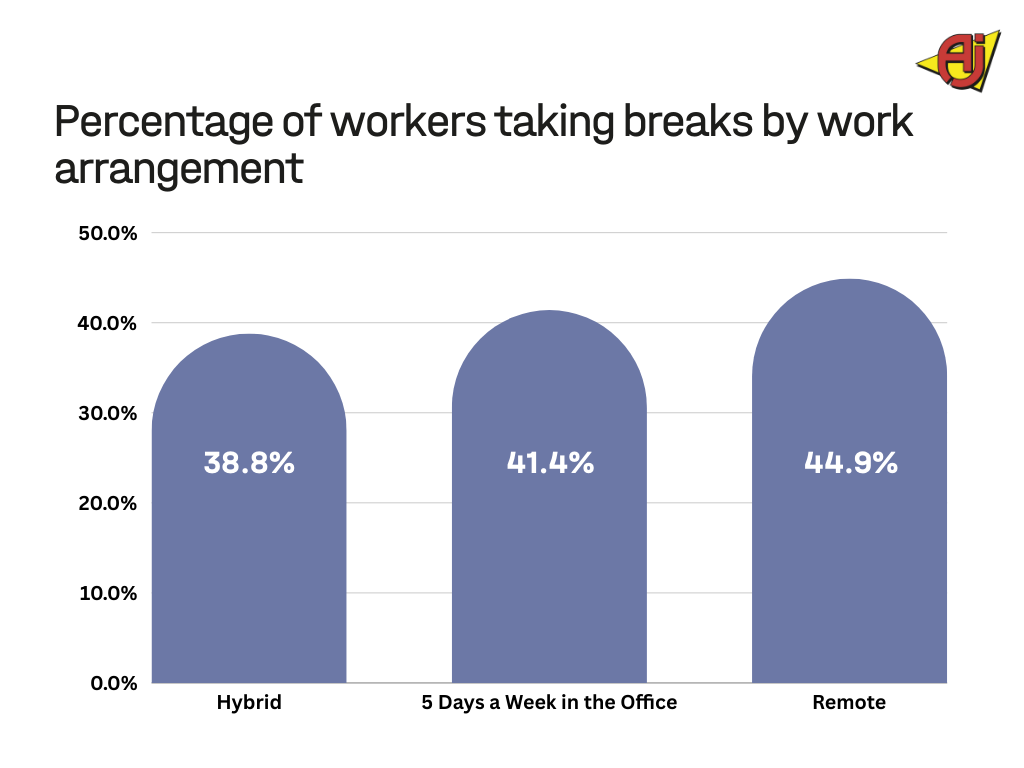
- Of everyone surveyed, hybrid workers are the least likely to take hourly breaks.
- 38.78% of hybrid workers report taking hourly breaks from their desk.
- This is compared to 41.43% of those who go to the office 5 days a week, as well as 44.93% of those who work fully remotely.
Work Set Up
- Hybrid: 38.8%
- 5 Days a Week in the Office: 41.4%
- Remote: 44.9%
As part of our survey, we also asked each participant – including the respondents who, at the time the survey was conducted, didn’t have a desk job - how often they experience back, neck or shoulder pain.
Whilst a clear correlation is difficult to establish between how often one takes a break from their desk and how often one feels neck, shoulder or back pain – a representative survey like this helps us to understand the scale of the problem, and allows us to identify the age groups, genders and working styles that deal the most with this sort of pain.
Which UK city’s workers are the most likely to take hourly breaks from their desks?
The UK’s cities are diverse in culture, personality, and industrial heritage, but with more businesses spreading their operations across the UK, it’s worth considering if the city one is situated in affects the frequency of breaks taken.
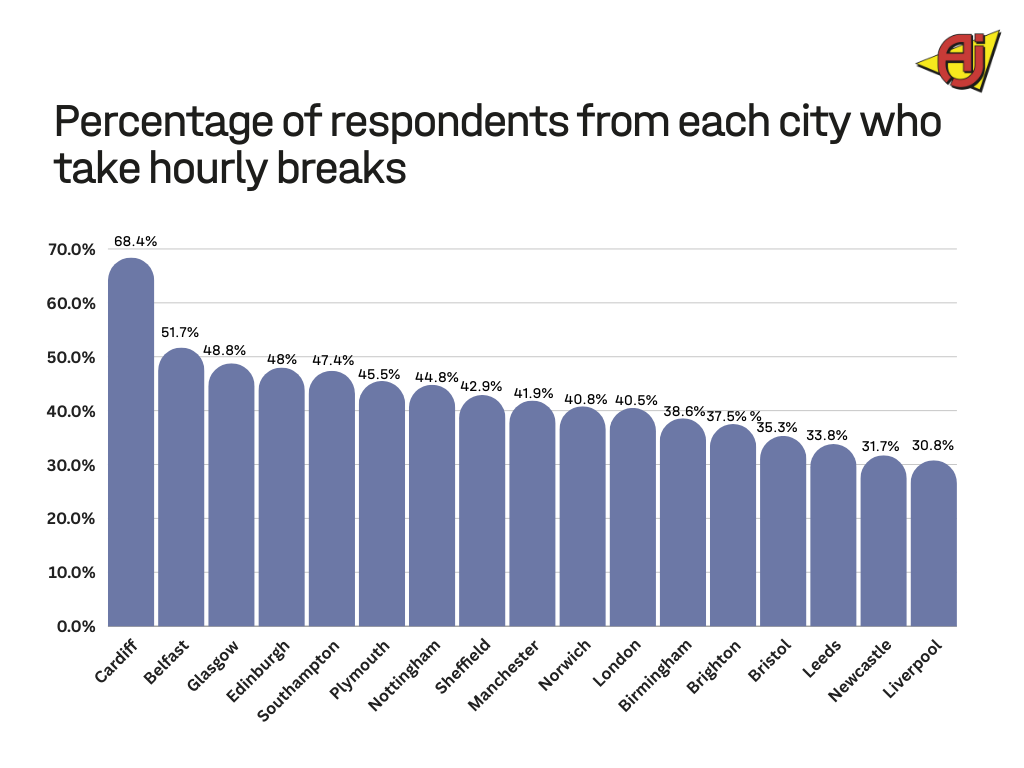
Cardiff is the city where workers are most likely to take hourly breaks from their desks. 68.4% of respondents with desk jobs from Cardiff report taking at least one break per hour over the working day.
It’s interesting to note that, in terms of the likelihood of workers taking hourly breaks from their desks, the top four cities are all outside of England.
- Cardiff has the highest percentage of workers who take hourly breaks from their desk (68.4%),
- Followed by Belfast (51.7%),
- Then Glasgow (48.8%),
- And finally, in 4th position, Edinburgh (48.0%).
- Of the English cities, Southampton has the highest percentage of workers who take hourly breaks from their desk (47.4%).
The city where desk job workers are least likely to take hourly breaks is Liverpool, with only 30.8% of respondents from Liverpool saying they take hourly breaks.
CLICK TO VIEW FULL DATA SET TABLE
| City | % of Respondents Taking Hourly Breaks |
|---|---|
| Cardiff | 68.4% |
| Belfast | 51.7% |
| Glasgow | 48.8% |
| Edinburgh | 48.0% |
| Southampton | 47.4% |
| Plymouth | 45.5% |
| Nottingham | 44.8% |
| Sheffield | 42.9% |
| Manchester | 41.9% |
| Norwich | 40.8% |
| London | 40.5% |
| Birmingham | 38.6% |
| Brighton | 37.5% |
| Bristol | 35.3% |
| Leeds | 33.8% |
| Newcastle | 31.7% |
| Liverpool | 30.8% |
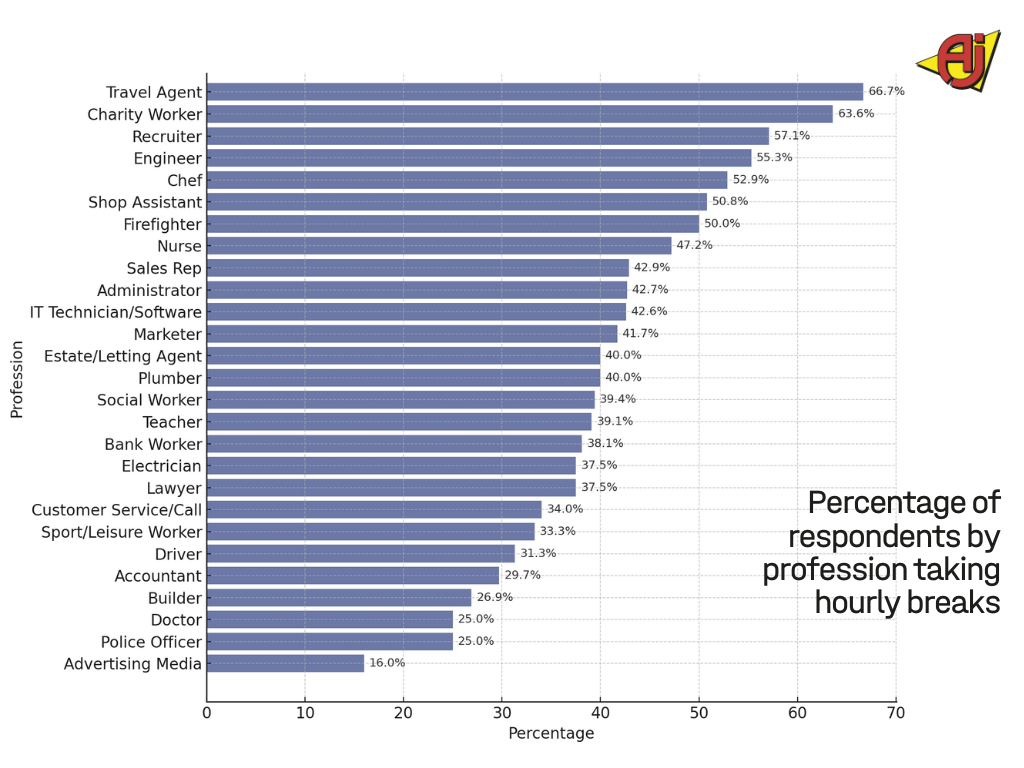
Hourly desk breaks by profession
Breaking down the data by profession allows us to hypothesise about whether there’s a relationship between the sector and the number of breaks taken over the course of the day.
- People representing a wide range of professions were surveyed, with travel agents standing out as the group most likely to take at least one break per hour.
- 66.7% of travel agents report taking at least one break from their desk per hour.
- Charity workers are the 2nd most likely group to take hourly desk breaks, with 63.6% of charity workers taking at least one break per hour.
- The 3rd most likely group are recruiters, with 57.1% of recruiters taking at least one break per hour.
On the lower end of the spectrum are doctors, police officers, and people working in advertising/media.
- 25% of doctors take hourly desk breaks.
- 25% of police officers take hourly desk breaks.
- 16% of advertisers take hourly desk breaks.
The only group surveyed with respondents who go for more than 5 hours before taking a break from their desk are nurses and bank workers.
- 2.4% of bank workers go more than 5 hours without taking a break from their desk.
- 2.8% of nurses go more than 5 hours without taking a break from their desk.
CLICK TO VIEW FULL DATA SET TABLE
| Profession | % of Respondents Taking Hourly Breaks |
|---|---|
| Travel Agent | 66.7% |
| Charity Worker | 63.6% |
| Recruiter | 57.1% |
| Engineer | 55.3% |
| Chef | 52.9% |
| Shop Assistant | 50.8% |
| Firefighter | 50% |
| Nurse | 47.2% |
| Sales Rep | 42.9% |
| Administrator | 42.7% |
| IT Technician/Software | 42.6% |
| Marketer | 41.7% |
| Estate/Letting Agent | 40% |
| Plumber | 40% |
| Social Worker | 39.4% |
| Teacher | 39.1% |
| Bank Worker | 38.1% |
| Electrician | 37.5% |
| Lawyer | 37.5% |
| Customer Service/Call | 34.04% |
| Sport/Leisure Worker | 33.3% |
| Driver | 31.3% |
| Accountant | 29.7% |
| Builder | 26.9% |
| Doctor | 25% |
| Police Officer | 25% |
| Advertising Media | 16% |
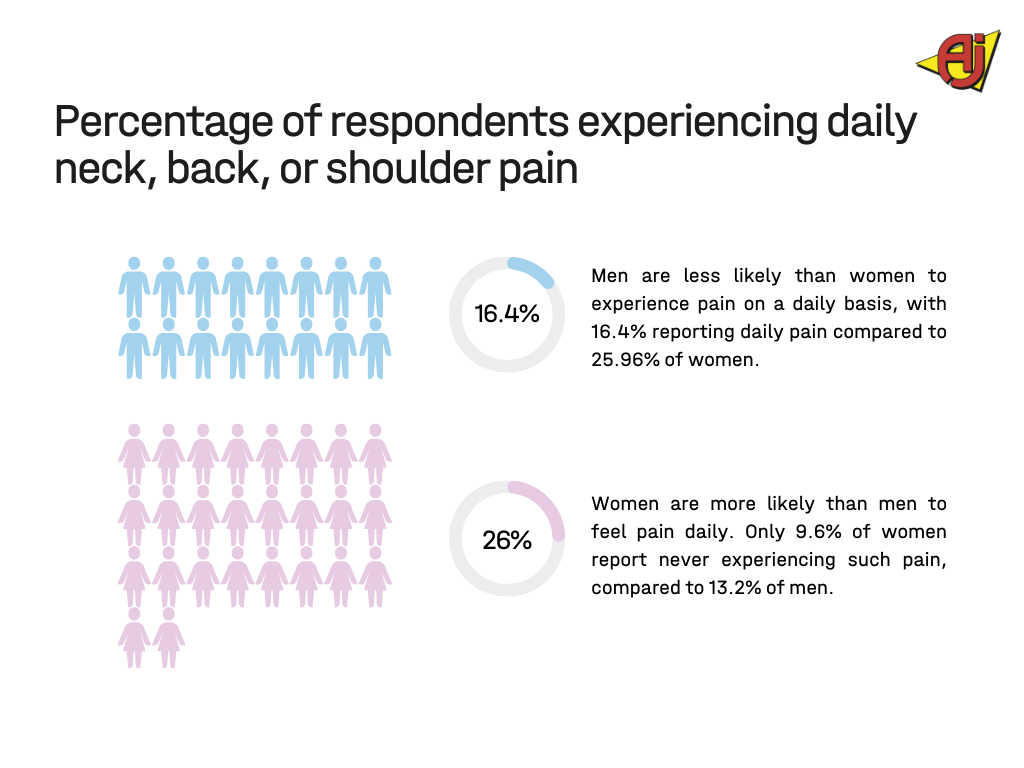
How many UK adults experience daily neck, back or shoulder pain?
- 21.3% of UK adults report feeling neck, back or shoulder pain every day.
- Women are more likely than men to feel pain on a daily basis, with 25.96% of women experiencing pain every day compared to 16.4% of men.
- Furthermore, 13.2% of men report never experiencing neck or shoulder pain, compared to the 9.6% of women that can say the same.
CLICK TO VIEW DAILY PAIN STATISTICS BY GENDER
| Gender | % Experiencing Pain Daily |
|---|---|
| Women | 26% |
| Men | 16.4% |
Which age group is most likely to experience daily neck, back or shoulder pain?
With more years of wear and tear under their belt, it’s unsurprising that older respondents were the group most likely to report feeling some sort of pain every day.
- 45-54 year olds are the age group most likely to experience daily neck, back or shoulder pain. 55+ year olds are only slightly less likely to report experiencing pain on a daily basis.
- 26.3% of the 45-54 year olds surveyed report feeling back, neck or shoulder pain every day.
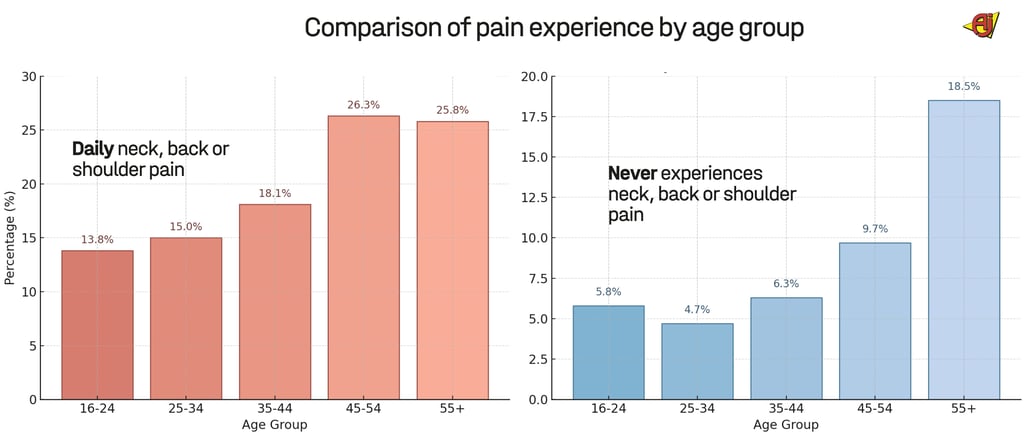
% of age group that feel neck/back/shoulder pain every day
- 16-24 year olds: 13.8%
- 25-34 year olds: 15%
- 35-44 year olds: 18.1%
- 45-54 year olds: 26.3%
- 55+ year olds: 25.8%
However, those aged 55+ are also the age group most likely to never experience any back/neck/shoulder pain. When compared to 25-34 year olds, in the graph below, it demonstrates that ageing, by itself, doesn’t result in the onset of pain, but rather other factors, like posture and lifestyle, play a significant role too. It should be noted, for example, that of the desk workers surveyed, those aged 55+ were the most likely to take at least one break per hour.
% of age group that never feel any neck/back/shoulder pain
- 16-24 year olds: 5.8%
- 25-34 year olds: 4.7%
- 35-44 year olds: 6.3%
- 45-54 year olds: 9.7%
- 55+ year olds: 18.5%
Does where one works from (i.e., home, at the office etc.) affect the likelihood of them developing daily neck, back or shoulder pain?
Is one type of working arrangement statistically more likely to result in pain than another? The below gives us an indication:
- Remote workers are the most likely to experience neck, back or shoulder pain on a daily basis.
- 21.3% of remote workers report feeling pain every day, compared to 18.2% of those who go to the office 5 days a week, and 13.02% of those with a hybrid arrangement.
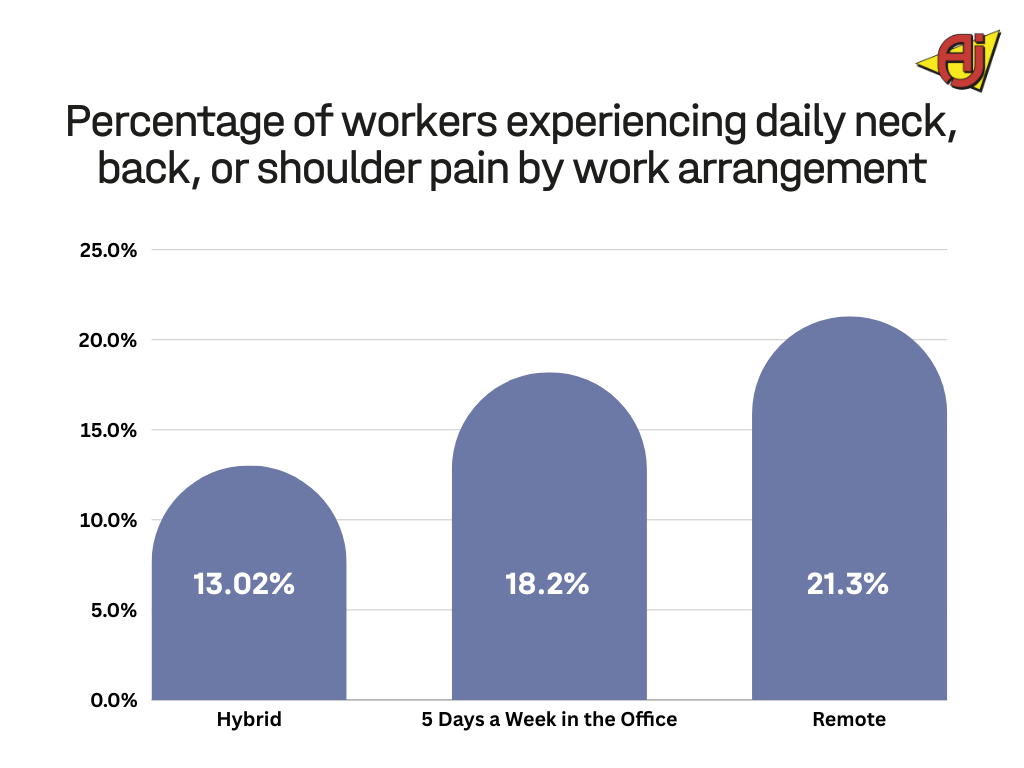
Work Set Up
% that experience neck/back/shoulder pain every day
- Remote: 21.3%
- 5 Days a Week in the Office: 18.2%
- Hybrid: 13.02%
Having said that, 9.5% of those who work remotely also report never feeling any neck or shoulder pain at all, compared to 8.2% of full time in the office workers, and 7.2% of hybrid workers.
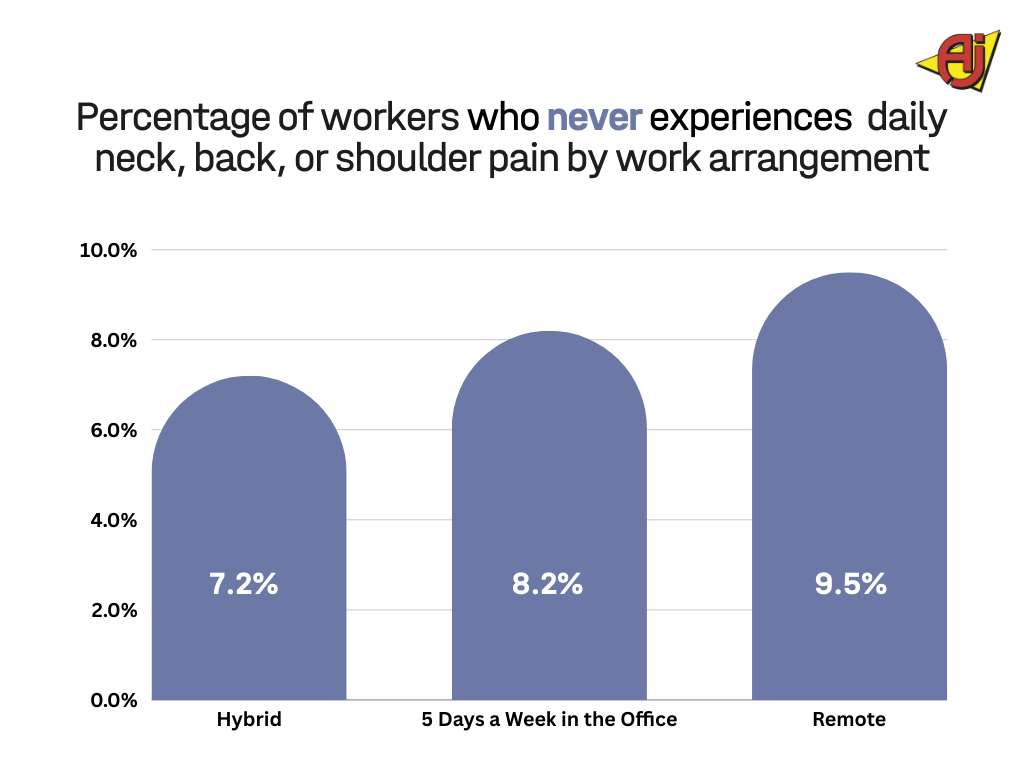
Work Set Up
% that never feel neck/back/shoulder pain
- Remote: 9.5%
- 5 Days a Week in the Office: 8.2%
- Hybrid: 7.2%
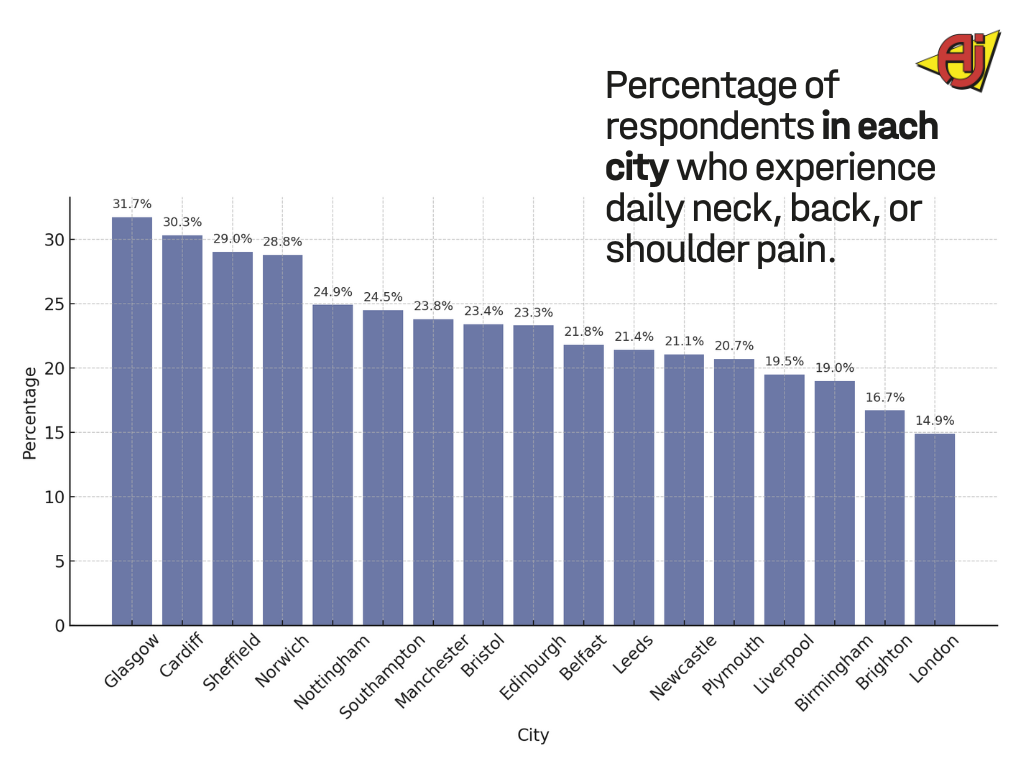
Which UK city’s workers are the most likely to experience daily neck, back, or shoulder pain?
Does the city where one is based affect the likelihood of experiencing pain and, if so, which city struggles the most?
- Glasgow is the city in the UK with the highest percentage of people that report feeling pain in their backs/necks/shoulders every day.
- 31.7% of the Glaswegians report feeling pain every day.
- On the lower end of the spectrum is London, with 14.9% of Londoners reporting feeling pain every day.
CLICK TO VIEW DAILY PAIN STATISTICS BY CITY
| City | % Experiencing Pain Daily |
|---|---|
| Glasgow | 31.7% |
| Cardiff | 30.3% |
| Sheffield | 29.03% |
| Norwich | 28.8% |
| Nottingham | 24.9% |
| Southampton | 24.5% |
| Manchester | 23.8% |
| Bristol | 23.4% |
| Edinburgh | 23.3% |
| Belfast | 21.8% |
| Leeds | 21.4% |
| Newcastle | 21.05% |
| Plymouth | 20.7% |
| Liverpool | 19.5% |
| Birmingham | 19% |
| Brighton | 16.7% |
| London | 14.9% |
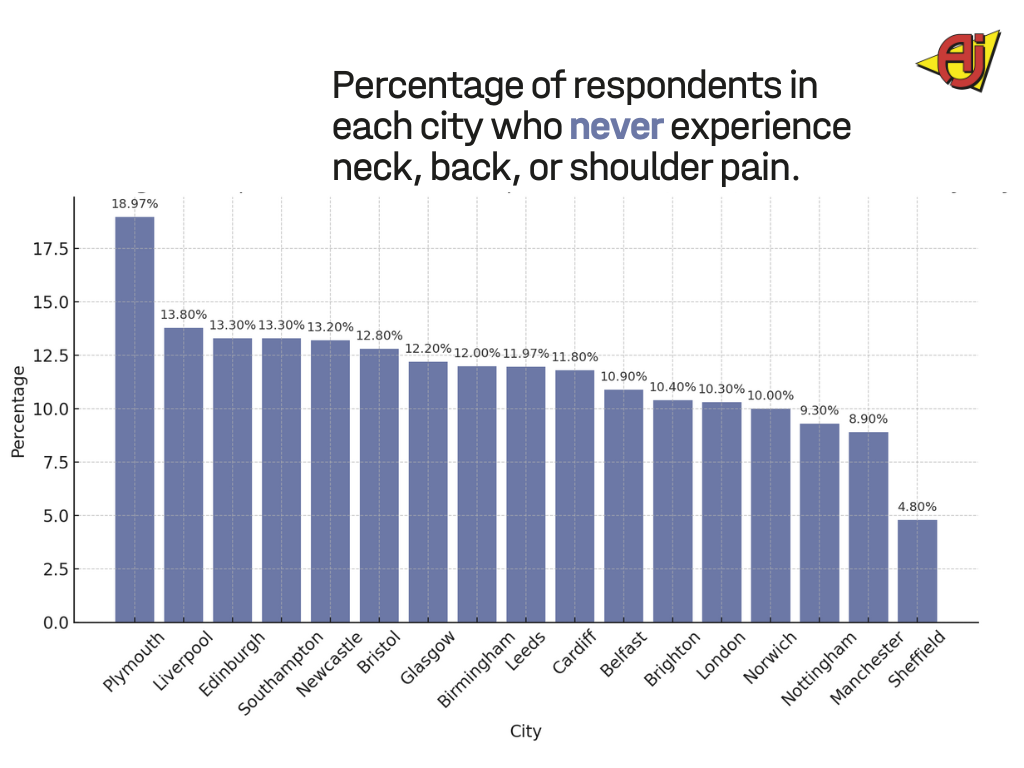
Which UK city’s workers are least likely to experience neck, back, or shoulder pain?
Of the UK cities surveyed, Plymouth stands out as the city with the highest percentage of respondents reporting they never feel neck, back, or shoulder pain.
- 18.97% of respondents from Plymouth report never experiencing pain.
Conversely, Sheffield has the lowest percentage of respondents reporting they never feel any neck, back, or shoulder pain, at 4.8%.
CLICK TO VIEW CITIES LEAST LIKELY TO EXPERIENCE PAIN
| City | % Never Experiencing Pain |
|---|---|
| Plymouth | 18.97% |
| Liverpool | 13.8% |
| Edinburgh | 13.3% |
| Southampton | 13.3% |
| Newcastle | 13.2% |
| Bristol | 12.8% |
| Glasgow | 12.2% |
| Birmingham | 12% |
| Leeds | 11.97% |
| Cardiff | 11.8% |
| Belfast | 10.9% |
| Brighton | 10.4% |
| London | 10.3% |
| Norwich | 10% |
| Nottingham | 9.3% |
| Manchester | 8.9% |
| Sheffield | 4.8% |
Limitation of our survey
This survey has been designed to be as statistically representative as possible of UK adults, with 2,015 participants, across a broad range of professions, responding to our survey.
However, in terms of weighting, some professions are overrepresented whilst others are underrepresented due to the nature of a survey like this, with more respondents working in a particular field than others.
The degree of pain and frequency of pain experienced are also based upon the opinions and recollections of participants taking part in this survey.
This survey was carried out by workplace product suppliers “AJ Products UK Ltd”. If you have any questions about the findings of this survey, including the process in which this data was collected, please do not hesitate to get in touch.